
Which withdrawal strategy fits you?
Before any maths, decide what kind of retiree you are. The "safe" rate depends as much on what you want from your money as on the historical numbers. Below are the four most common positions UK drawdown clients take, with the strategy that fits each. None of them is wrong; they sit on a slider between maximum certainty and maximum income.
- 1 I want a simple rule of thumb→ Start at 3.5-4% of your pot in year one. Take that amount each year and increase it with CPI. Review every five years. Simple, well-evidenced, and what the 4% rule was designed for.
- 2 I want to maximise income and accept variability→ Guyton-Klinger guardrails. Start higher (5-5.5%), but cut withdrawals by 10% if your pot drops 20% below its real starting value. Raise them by 10% if the pot rises 20%.
- 3 I want to preserve capital for family→ Stay below 3%, or use a "natural yield" strategy - spend only dividends, interest and rental income, never the capital. Inheritance is the goal.
- 4 I want a guaranteed income, no surprises→ Annuitise some or all of the pot. Or run a "floor and upside" split: annuity to cover essentials, drawdown the rest for flexibility.
The 4% rule, in one paragraph
The 4% rule is a piece of US retirement maths. In October 1994, financial planner William Bengen published Determining Withdrawal Rates Using Historical Data in the Journal of Financial Planning. Using US stock and bond data from 1926 to 1976, he back-tested every possible 30-year retirement window from a 50/50 portfolio of US large-cap equities and intermediate Treasury bonds. He found that a starting withdrawal of 4% of the pot in year one, rising each year with inflation, was the highest rate that survived even the worst 30-year sequence (a retiree who began in 1966 and lived through the 1970s stagflation). The 1998 Trinity Study - Cooley, Hubbard and Walz at Trinity University - repeated the analysis with extended data and reached the same broad conclusion. The 4% rule was born.
- US stock and bond data, 1926-1976
- 50% US large-cap equities, 50% intermediate-term Treasury bonds
- 30-year retirement horizon
- Pre-fee returns (no platform or fund charges)
- Inflation adjustment: full CPI uplift every year, in every market condition
- Success defined as "did not deplete by year 30" - not "had money to spare"
Every one of those assumptions has to be flexed for a UK retiree in 2026. That's where the Morningstar numbers come in.
The UK figure today: 3.7% (and why)
Morningstar publishes annual research called The State of Retirement Income, written by Christine Benz, Amy Arnott and Jason Kephart. The headline number is the highest starting percentage of the pot a retiree can withdraw in year one, rising with inflation thereafter, with a 90% probability that the pot is not depleted at the end of a 30-year retirement. The research uses forward-looking Monte Carlo simulations seeded with Morningstar's capital market assumptions - current bond yields, current equity valuations, expected inflation - rather than pure backtesting on historical data.
The recent track record:
- 2022: 3.8% - Morningstar's first downward revision from the 4% rule, citing high equity valuations and low bond yields.
- 2023: 4.0% - bond yields rose sharply through 2022, lifting expected returns.
- 2024: 3.7% - equity valuations climbed and bond yields softened slightly.
- 2025: 3.9% - yields improved again; equity weighting band widened to 30-50%.
For a UK retiree, the picture is fractionally more conservative again. Earlier UK-specific research (Blanchett, Buffenoir, Kemp and Watt, Morningstar 2016) using purely UK data put the figure between 3.0% and 3.5% - primarily because UK long-run real equity returns have run about 1.3-1.6 percentage points below the US, UK platform and fund charges add another 0.5-1.0% a year of drag, and longevity at 65 in the UK is rising. Bring those together and a planning figure of 3.5-4.0% for a UK retiree in 2026 is conservative enough for most purposes; 3.7% is a reasonable single number to plan with.
Strategy comparison - five ways to draw an income
These are the five most-used withdrawal frameworks in UK retirement planning. They are not mutually exclusive - many real-world retirees blend two (most commonly 4%-with-CPI for a "main" pot and natural yield for an ISA used for bequests). The right framework depends on three things: how big a margin of safety you want, how much income variability you can stomach, and how important an inheritance is.
| Strategy | Starting rate | What happens in year 2 | Best for | Risk |
|---|---|---|---|---|
| 4% rule (Bengen) | 4% of pot in year 1; +CPI thereafter | Rises with inflation, regardless of returns | Simplicity | Pot exhaustion in bad sequences |
| Morningstar UK 3.7% | 3.7% of pot in year 1; +CPI thereafter | Rises with inflation, regardless of returns | UK retirees wanting fixed real income | More conservative - leaves money on the table in good runs |
| Guyton-Klinger guardrails | 5-5.5% of pot in year 1 | Cut 10% if pot is 20% below original; rise 10% if pot is 20% above | Maximising income, willing to flex | Income variability; discipline required |
| Yale Endowment / spending rule | ~5% of current pot | 70% of last year + 30% of (5% × current pot) | Long horizons; smooth spending | Complex; income falls in long drawdowns |
| Natural yield | Whatever dividends + interest are (~2.5-4%) | Whatever the next year's yield is | Preserving capital for family | Yield-chasing; income variability |
The shortest sensible summary: a fixed-rule strategy (rows one and two) gives a predictable income but no upside in good markets and no protection in bad ones. A dynamic strategy (rows three and four) gives a higher expected income at the cost of variability - you have to be able to absorb a 10-20% income cut after a market fall, and the cuts are real, not hypothetical. Natural yield (row five) preserves capital almost by definition; it is the choice when leaving an inheritance ranks above maximum lifetime spending. Most regulated UK advisers run a soft version of guardrails - a fixed inflation-adjusted withdrawal in normal years, with explicit cuts agreed in advance after a 15-20% portfolio fall.
Sequence-of-returns risk: the hazard you cannot diversify away
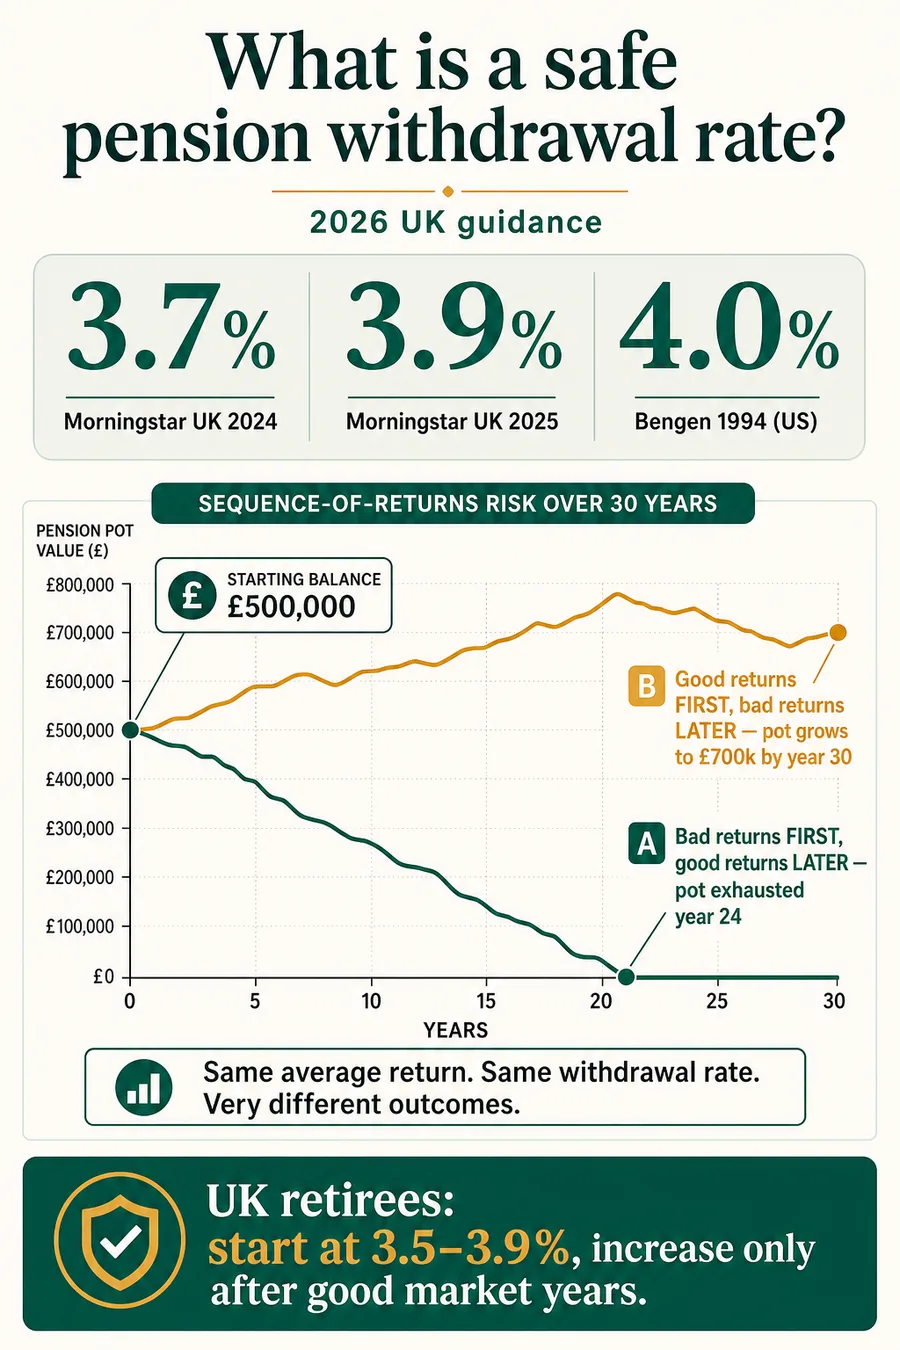
Average returns lie. A 30-year retirement with an average annual return of 5% nominal can end with a pot of £1 million or with nothing. The order of the returns - what statisticians call the path, and what retirement planners call the sequence - is the thing that matters. A retiree withdrawing 4% of a £500,000 pot in year one, then £20,500 in year two, then £21,000 in year three is selling units regardless of price. If those years see a 30% market fall, every withdrawal locks in part of that loss. The pot has less to compound back on the way up. The same retiree who happens to retire just before a strong decade can withdraw the same inflation-linked income, see the pot grow despite the withdrawals, and end up with more in real terms than they started with.
Worked example - same average, two sequences, £500k pot
Starting pot £500,000. Withdraw 4% (£20,000) in year one, rising by 2.5% inflation each year. Both sequences average exactly the same return over 30 years: five years of poor returns (−10%, −15%, −5%, +5%, +10%) plus 25 years at +6% - arithmetic mean 5.0% nominal. The only difference is the order.
Years 1-5: −10%, −15%, −5%, +5%, +10%. Then 25 years at +6%. By the end of year 5 the pot is around £318,000, the 4% rule withdrawal has already grown to £22,000 with inflation, and the compounding base is permanently smaller. Recovery from that point is real but slow.
25 years at +6% first. The pot grows substantially while withdrawals are still small in real terms, so by year 25 there's a large cushion. The −10%, −15%, −5%, +5%, +10% run in years 26-30 takes a chunk out but the retiree finishes far ahead of Sequence A.
The arithmetic mean of both sequences is identical. The geometric mean differs slightly (bad years early compound differently to bad years late), but the dominant cause of the gap is not the returns - it's the withdrawals. The retiree in Sequence A finishes with £361,310 less, despite the markets having "averaged out" by the end. Three things help: a cash buffer, dynamic withdrawals, and partial annuitisation.
Practical defences against sequence risk
Three steps make a meaningful difference. None is exotic; all three are standard parts of a well-built UK drawdown plan.
- Hold one to two years of withdrawals in cash. When markets fall, you draw from the cash buffer rather than selling fund units at the bottom. Top it up in good years. A £500,000 pot drawing £20,000 a year wants a £20,000-£40,000 cash buffer - typically a high-rate Cash ISA or premium bonds. The opportunity cost (cash earning less than the equity portion) is real but small, and the protective effect on a bad sequence is large.
- Pre-commit to dynamic withdrawals. Write down - ideally before you retire - the rule you will apply after a 15% or 20% portfolio fall. "Skip the inflation rise" is the easiest; "cut nominal income by 10%" is more powerful. The point is to remove the discretion from a stressful moment.
- Annuitise enough to cover essentials. If your State Pension plus a small annuity covers food, energy, council tax and basic transport, your drawdown pot only has to fund the discretionary 30-40% of your spending. That changes the psychology of a market fall completely - you don't have to sell anything.
Will your pot last? - inline calculator
3.7% = Morningstar UK 2024. 4% = classic Bengen.
5% nominal is a typical 60/40 long-run assumption after fees.
2.5% is the Bank of England 2% target plus a small buffer.
30 years is the default UK planning horizon (retiring at ~67, planning to 97).
Your pot lasts 30 years on these assumptions, with around £432,632 still in the pot at the end. Stress-test by reducing the return or increasing inflation; sequence risk does not show up in a single average return.
This is a deterministic projection: a single fixed return every year. Real-world returns vary, and sequence-of-returns risk means an identical average can produce very different outcomes (see the worked example above). For a full Monte Carlo simulation use the Pension Wise service or a regulated adviser.
Three real UK scenarios
Situation: Cautious. Wants a simple, predictable income. Comfortable with one inflation-linked figure each year.
Roger applies the Morningstar UK 3.7% figure to his £400,000 pot, indexed to CPI. He withdraws £14,800 in year one (3.7% × £400,000), rising each year with inflation. Combined with the full new State Pension (£12,547.60 in 2026/27) he has a total pre-tax income of £27,348 in year one.
- State Pension: £12,547.60/yr
- Drawdown: £14,800/yr starting, +CPI
- Total: £27,347.60/yr before tax
- Income tax: personal allowance £12,570 → ~£2,956/yr at 20% basic rate
- Net: ~£24,392/yr
Roger lands comfortably above the PLSA "Minimum" single line (£13,400) and within touching distance of "Moderate" single (£31,700). Because his strategy is fixed, he doesn't need to make decisions every year - he can ignore the financial press. The cost is that he has no upside in good markets and no downside protection in bad ones, so he also holds two years of withdrawals (£30,000) in a Cash ISA as a sequence-risk buffer.
Situation: Single, healthy, wants more income now. Willing to take less if markets fall.
Jane runs a Guyton-Klinger guardrails approach. She starts at 5% of her £200,000 pot - £10,000 in year one. She sets her "original" real withdrawal rate at 5%, calculates 20% guardrails (so cut if the current rate exceeds 6.0%; raise if it falls below 4.0%), and reviews each January.
- Year 1 (2026): £10,000 withdrawn
- Year 2 (2027): +2.5% inflation → £10,250 planned. Pot up 4% to £197,500 net of withdrawal - no guardrail breach. £10,250 paid.
- Year 3 (2028): Markets fall 15%. Pot now £155,000. New rate would be £10,506 / £155,000 = 6.8% - above the 6.0% upper guardrail. Cut withdrawal by 10% to £9,000.
- Year 4 onwards: Hold £9,000 (+ skip-inflation rule) until pot recovers back above the guardrail.
Jane gets £10,000+ a year in normal markets - meaningfully more than the £7,400 she would have under a 3.7% rule - at the price of a real-terms cut after a bad year. The rule is mechanical, which is the point: she doesn't have to make a discretionary decision about cutting her own income.
Situation: Couple, retired at 68 in 2025 on a fixed 4% strategy. Markets fell 18% in their year two.
Wendy and Pete started in May 2025 with a £600,000 pot, drawing £24,000 in year one (4%). By December 2026 their portfolio is down 18% net of withdrawals to £472,000. Their year-two planned withdrawal under the 4% rule (with 2.5% inflation) is £24,600 - which would be 5.2% of the new pot, well above any sensible "recovery" rate.
- Sequence damage: a 4% rule starting £24,000 from a £600k pot can survive a bad sequence - but only if they cut. Skipping the inflation rise alone in year two doesn't fix the maths.
- The fix: apply a Guyton-Klinger-style cut. £24,000 × 0.9 = £21,600 for year two. Hold there until the pot recovers above its original real value.
- Cash buffer: their two-year cash buffer (£48,000) means they don't have to sell funds at the bottom - they fund withdrawals from cash through 2027 and only sell equities once the market has stabilised.
Without the cut, Morningstar's Monte Carlo work suggests their pot has a roughly 25-30% probability of failing inside 30 years; with the cut, that drops below 10%. The two-year cash buffer plus an annuity covering essentials (~£15,000/yr added at age 75) would push the failure probability close to zero. Pension Wise sessions are free and government-backed; Wendy and Pete book one immediately to validate the revised plan.
Pension freedoms and why this matters
Before April 2015, the only sensible way to turn a UK defined-contribution pension into an income was to buy an annuity. The 4% rule was a US academic curiosity. The 2015 pension freedoms changed that overnight: drawdown became the default, annuities collapsed by three-quarters between 2013 and 2024 (IFS Pensions Review 2025), and millions of UK retirees are now running their own withdrawal strategy. The IFS describes the result as a "decumulation problem" - large numbers of people make irreversible income decisions without the analytical tools (or, often, the advice) they need.
The practical implication for you: a safe withdrawal rate is not a regulator's number; there is no FCA-mandated "safe" figure. The 3.7% Morningstar headline is research, not regulation. Pension Wise - the free, government-backed guidance service delivered by MoneyHelper - is the standard first step. A regulated adviser is the standard second step for anyone with a pot above roughly £100,000 or with any complexity (defined benefit transfer, multiple pots, spouse with own pension, tax planning). The cost of advice for a one-off decumulation review is typically £1,500-£3,000 in 2026; over a 30-year retirement on a £500k pot, that's money very well spent.
Why the UK SWR is lower than 4%
Long-run returns. The UBS / Dimson, Marsh and Staunton Global Investment Returns Yearbook 2025 (the canonical 125-year dataset) puts US equity real returns at around 6.6% a year for 1900-2024. UK equity real returns over the same window are closer to 5.0-5.3%. That 1.3-1.6 percentage-point gap compounds materially over 30 years.
Charges. UK platform plus fund fees of 0.5-1.0% a year subtract directly from the safe rate. Bengen's 1994 paper used pre-fee indices. The "4% rule" effectively assumes zero costs.
Longevity. ONS National Life Tables 2022-24 give a UK 65-year-old woman a life expectancy of 21.2 years and a 65-year-old man 18.7 years - both medians, with the upper-quartile retiree living past 95. UK retirees typically plan to age 95-97; the 4% rule was built around a 30-year horizon from age 65.
Net effect on the headline rate: roughly 0.3 percentage points lower than the equivalent US figure. Bengen's 4% becomes Morningstar's 3.7% becomes "plan for 3.5-4.0% and flex."
Guyton-Klinger guardrails - earn higher income, accept the rules
The Guyton-Klinger guardrails approach was set out by Jonathan Guyton and William Klinger in the Journal of Financial Planning in 2006. The headline change versus Bengen is that you start higher - typically 5.0-5.5% of the pot in year one - and then apply a small set of rules each year.
- Capital preservation rule. If your current withdrawal rate (this year's withdrawal ÷ current pot) is more than 20% above the original starting rate, cut next year's withdrawal by 10%.
- Prosperity rule. If the current rate is more than 20% below the original rate, increase next year's withdrawal by 10%.
- Inflation rule. Skip the annual CPI uplift in any year your portfolio return was negative and the current rate is above the original.
- Withdrawal rule. Cap the maximum CPI rise at 6% in any one year.
Guyton and Klinger's back-tests showed that a 5.0-5.5% starting rate with these guardrails lasted 40 years across every historical sequence they tested - a hugely better income than a strict 4% rule, at the cost of real-terms variability of typically 10-20% in bad runs. Michael Kitces and others have flagged that the original guardrails can produce sharp income cuts late in retirement; modern "risk-based" guardrails (Kitces, 2022) refine the approach further.
The Morningstar view, in their words
Morningstar's 2024 State of Retirement Income report (Benz, Arnott, Kephart) put the position bluntly:
"For new retirees, our 2024 research lowers the highest safe starting withdrawal rate to 3.7% - down from 4.0% last year - assuming a 30-year time horizon, a 90% probability of not running out, and a portfolio with an equity weighting of between 20% and 50%. The decrease reflects higher equity valuations and modestly lower fixed-income yields than a year ago. Retirees willing to use a more flexible withdrawal strategy - varying the withdrawal amount each year based on portfolio performance - can support meaningfully higher starting withdrawal rates."
The 2025 update revised the figure to 3.9% as bond yields rose; the 30-year, 90%-confidence framing is unchanged.
Frequently asked questions
- What is a safe withdrawal rate from a UK pension?
- There is no single guaranteed figure, but the best UK-relevant evidence today is Morningstar’s annual "State of Retirement Income" research. Their 2024 report set the highest "safe" starting withdrawal rate at 3.7% of the pot in year one, rising with inflation thereafter, for a 30-year horizon at 90% confidence and a 30-50% equity portfolio. Morningstar’s 2025 update lifted that to 3.9% after bond yields rose and equity valuations moderated. UK-focused research from David Blanchett et al. (2016, Morningstar) found a slightly lower figure of around 3.0-3.5% reflecting lower UK-specific return expectations and higher platform charges. In practice, most UK retirees plan around 3.5-4.0% as a starting rate, then adjust each year depending on how the portfolio actually performs.
- Is the 4% rule still valid in 2026?
- Yes, with caveats. The 4% rule comes from William Bengen’s 1994 paper, based on US data from 1926 to 1976 and a 50/50 portfolio of US large-cap stocks and intermediate Treasuries. Recent Morningstar research suggests the equivalent figure today is 3.7-3.9% for US retirees, and Blanchett’s UK-specific work has put it as low as 3.0-3.5% historically. Bengen himself revised his estimate upwards to around 4.7% in 2022 after broadening the asset mix to include small caps and Treasury bills. For a UK retiree with a typical 60/40 multi-asset fund, 4% is the upper end of "reasonable" rather than a safety floor - sensible only if you are willing to cut spending after a bad year.
- How much can I take from my pension each year?
- For most UK retirees the planning anchor is 3.5-4.0% of the starting pot in year one, rising with inflation. On a £200,000 pot that’s £7,000-£8,000 a year before tax. On £500,000 it’s £17,500-£20,000 a year. On £1,000,000 it’s £35,000-£40,000 a year. Layer the new State Pension on top (£12,547.60 in 2026/27 for the full rate) and your total pre-tax income comes into focus. You can take more - 5-6% - in the early years if you’re prepared to cut spending after a market fall (the "guardrails" approach), or you can take less (sub-3%) to leave a large bequest. There is no universal right number; it depends on your pot, your other income, your horizon, and your willingness to flex.
- What is sequence of returns risk?
- Sequence of returns risk is the danger that a market fall in the first few years of retirement does disproportionate damage to a drawdown pot - even if the long-run average return is identical to a "good early years" scenario. The reason: every pound you withdraw during a downturn is sold at a depressed price and can never recover. A pot that drops 30% in years 1-2 while you keep withdrawing inflation-linked income may never come back; the same 30% drop in years 25-26 is much less consequential. Morningstar, Vanguard and Royal London all show the same effect: identical 30-year average returns can leave you with £0 or with more than the starting pot depending purely on the order. The first five retirement years matter more than the next twenty-five.
- Why is the UK safe withdrawal rate lower than the US?
- Three reasons. First, long-run real returns. Over 1900-2024 the UBS / Dimson, Marsh and Staunton Global Investment Returns Yearbook puts US equity real returns at about 6.6% a year versus around 5.0-5.3% for the UK - a 1.3-1.6 percentage-point gap that compounds heavily over 30 years. Second, charges. UK platform plus fund fees of 0.5-1.0% a year are higher than what Bengen’s 1994 study assumed, which used pre-fee indices. Third, longevity. ONS data shows UK life expectancy at 65 is 21.2 years for women and 18.7 years for men in 2022-24, and planning to age 95 is standard. Combined effect: a UK retiree planning a 30-year inflation-adjusted income should expect to start nearer 3.5-4.0% than 4.0-4.5%.
- How long should my pension last?
- The standard planning horizon for a UK retiree is 30 years. ONS National Life Tables 2022-24 give a 65-year-old man a life expectancy of 18.7 more years and a 65-year-old woman 21.2 more years, but those are medians. Roughly one in four women aged 65 today will live past 92, and one in ten past 96. For couples there is a "joint" longevity to consider: the chance that at least one of you reaches 95 is well over 25%. Planning to 90 is the absolute minimum, 95 is sensible default, and 100 is appropriate if you have family history of long life, are healthy and non-smoking, or want a buffer.
- Can I withdraw 5% a year safely?
- Only if you are willing to cut spending after a bad year. Morningstar’s 2024-25 research shows that a strict 5% real withdrawal from a 50/50 portfolio fails (runs out before year 30) in roughly one-in-three historical and forward-looking simulations. Under a dynamic strategy - Guyton-Klinger guardrails, Vanguard’s "dynamic spending", or a simple "cut 10% after a 15% drop" rule - starting rates of 5-5.5% can be sustainable, because the rule automatically reduces spending after losses. The trade-off is that your income is no longer a guaranteed inflation-linked amount: in a bad decade you might be living on 15-20% less in real terms.
- What is the Guyton-Klinger withdrawal strategy?
- Guyton-Klinger is a dynamic, rule-based withdrawal framework set out by Jonathan Guyton and William Klinger in the Journal of Financial Planning in 2006. You start higher than a fixed 4% rule - typically 5.0-5.5% - then apply two main rules each year. The "capital preservation" guardrail: if your current withdrawal rate is more than 20% above the original (because the pot has shrunk), cut next year’s withdrawal by 10%. The "prosperity" guardrail: if the current rate is more than 20% below the original (because the pot has grown), increase next year’s withdrawal by 10%. Add an inflation cap (no rise in years when the portfolio fell) and you have a system that materially extends pot longevity in bad sequences while letting you spend more in good ones.
- Should I cut my withdrawals if markets fall?
- In drawdown, yes - modestly, and only after a meaningful fall. The maths is clear: every withdrawal during a deep drawdown locks in losses and shrinks the base your pot has to recover from. A simple, sensible rule is to skip the inflation rise in any year where your pot is more than 10% below the previous year’s peak, and cut nominal withdrawals by 10% if the pot is more than 20% below peak. Restore both when the pot recovers. Two practical defences make this easier to live with: keep one to two years of withdrawals in cash (so you don’t have to sell after a crash), and annuitise enough to cover essentials - so any cut only affects discretionary spending.
- Is drawdown safer than an annuity?
- Neither is universally safer. An annuity gives an absolute guarantee of income for life, with no investment risk - it is the only product in UK retirement that fully removes longevity risk. Drawdown keeps the pot invested, gives flexibility, and (under current rules until April 2027) passes the residual pot to beneficiaries free of inheritance tax. The risks are different, not greater or smaller. Annuities have inflation risk if you buy level rates and lose flexibility forever once purchased. Drawdown has sequence-of-returns risk and the real chance of running out if you withdraw too much. The IFS’s "flex and fix" framework - drawdown in early retirement, partial annuitisation around age 75-80 to lock in the high rates older retirees get - is the consensus current best practice.